Production capacity growth
Business capacity increased from 300 to 5,000 units per day during the engagement.
Farih Muwaffaq
Data Analyst · Jakarta
Data/Systems/Decisions
← Work index / PT Gajahpangan Jaya Makmur
Professional Experience FMCG
Used operational and commercial analysis to support production scaling, channel expansion, and more coordinated supply-chain decisions.
Published with protected details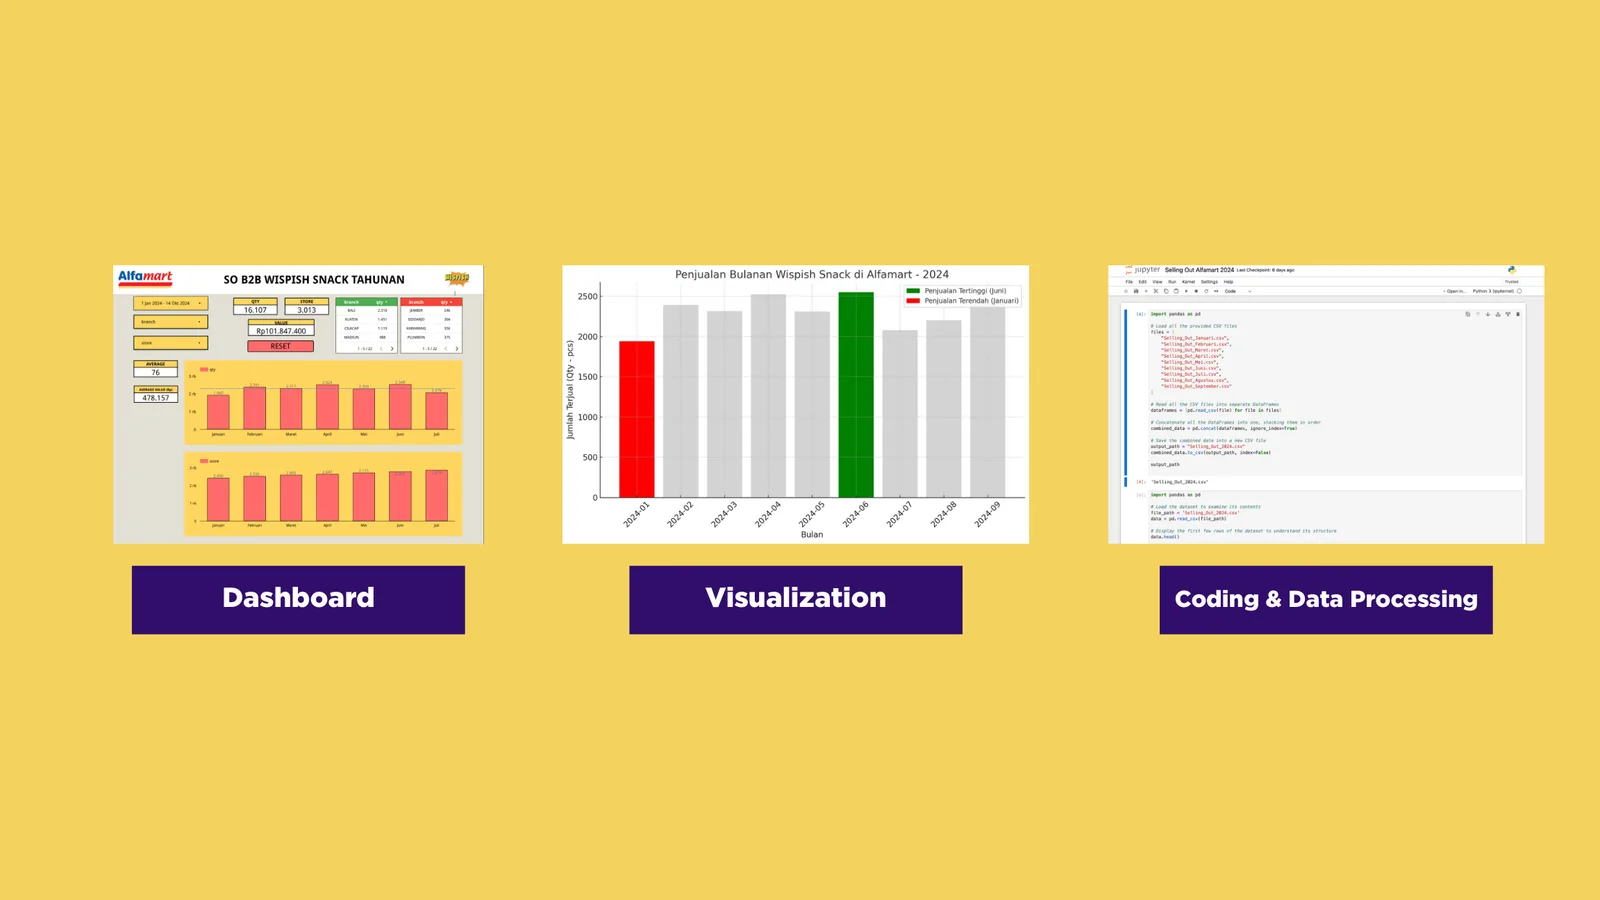
Business-level outcomes
Team outcomes supported by my analysis and broader operational execution.
Business capacity increased from 300 to 5,000 units per day during the engagement.
Business-level monthly profit increased from below IDR 100M to above IDR 700M during the engagement.
Work I directly owned or delivered within the broader team effort.
Analyzed production and profit bottlenecks to support operational scaling, including production-capacity planning and profit-oriented decision-making.
Used product, channel, and supply-chain analysis to guide commercial decisions, including B2B actual-versus-target evaluation and marketplace audience comparison.
Built decision-ready reporting that helped coordinate production, sales, and after-sales teams through shared views of units sold, revenue, daily performance, and inventory coverage.
Led the analysis, visualization, recommendation development, deck production, and stakeholder presentation end-to-end within the Gajahpangan Data team.
Developed a structured Wispish social-media activation plan covering audience direction, content themes, activation timing, and campaign recommendations.
Translated B2B performance and Shopee, Tokopedia, and TikTok Shop user research into channel-specific recommendations supporting Modern Trade, General Trade, and marketplace expansion.
Analysis frame
Technical judgment
The business needed coordinated operational and commercial decisions.
Operational execution required shared visibility across functions.
The results occurred within broader operational execution and should not be presented as individual-only impact.
Selected decision decks
Led analysis, visualization, recommendations, deck production, and stakeholder presentation end-to-end within the Gajahpangan Data team. Four approved examples spanning weekly sales, B2B performance, marketplace research, and social-media activation.
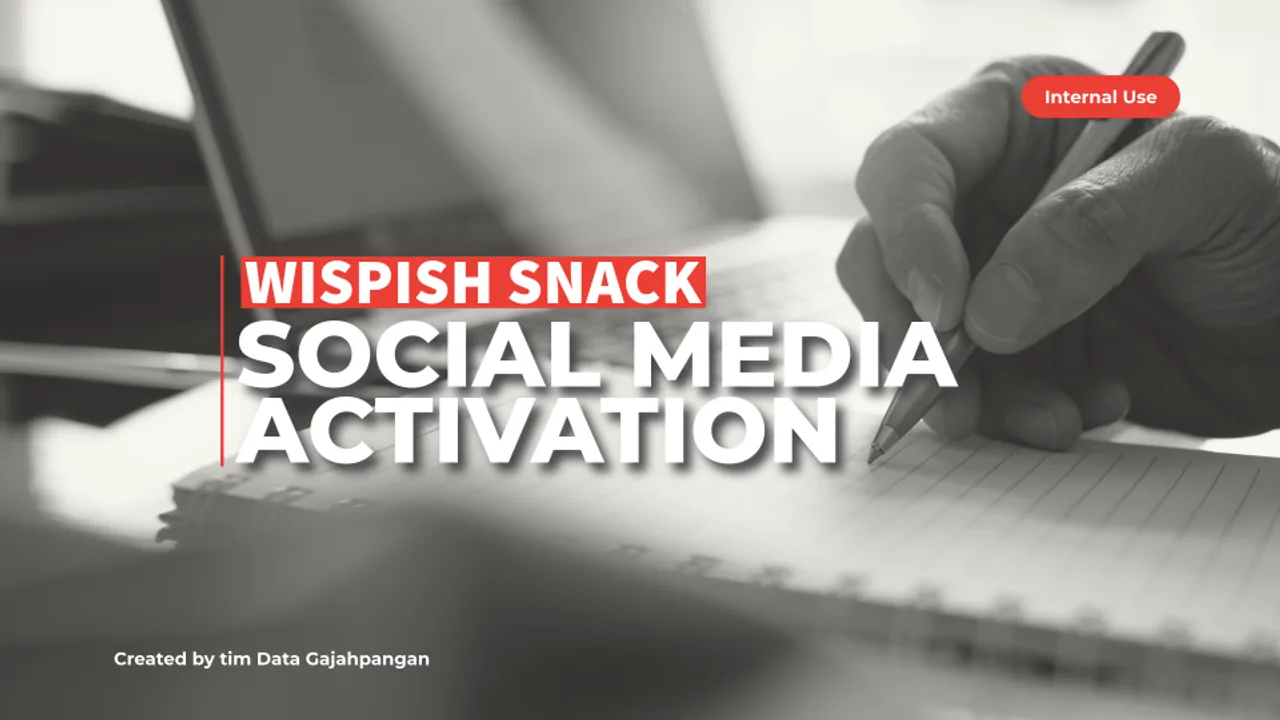
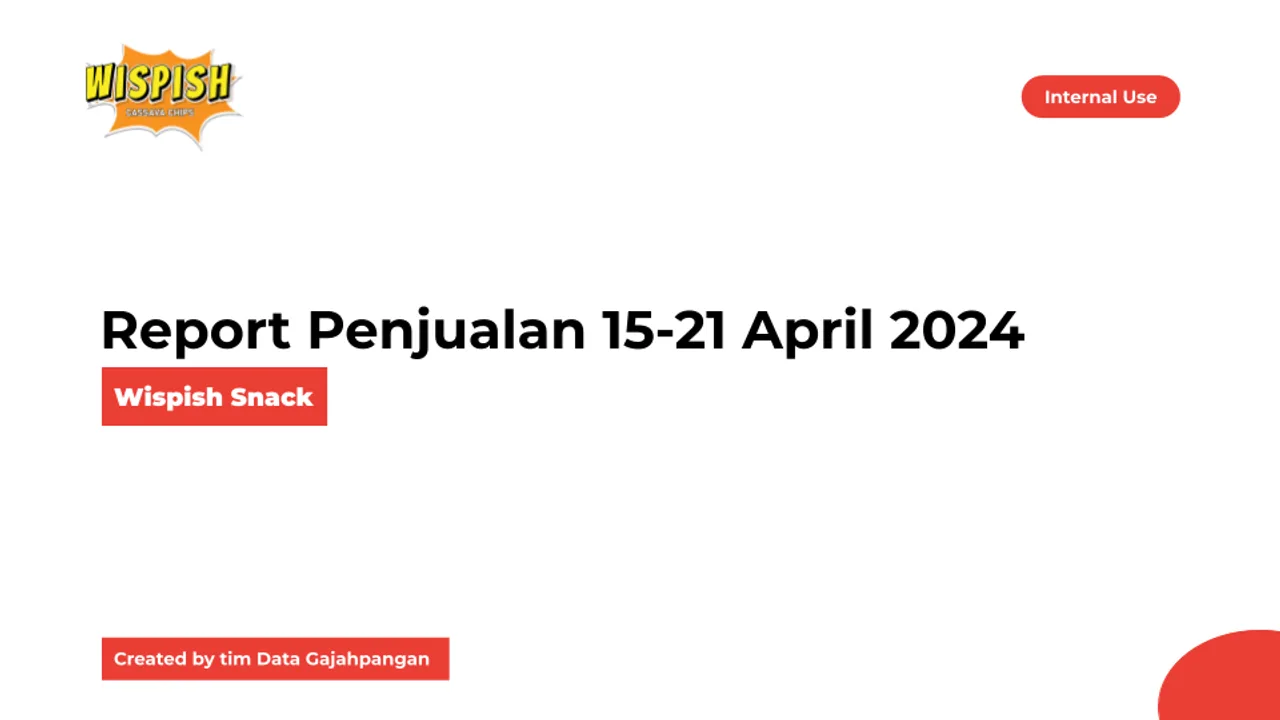
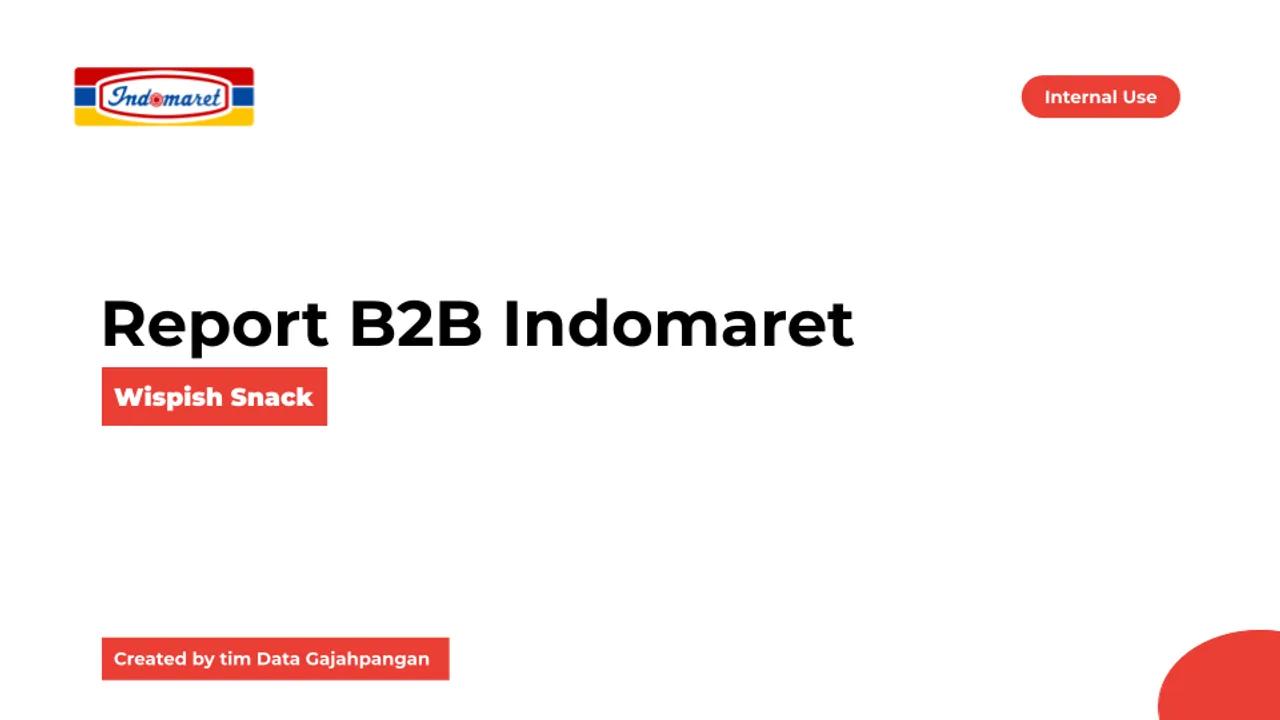
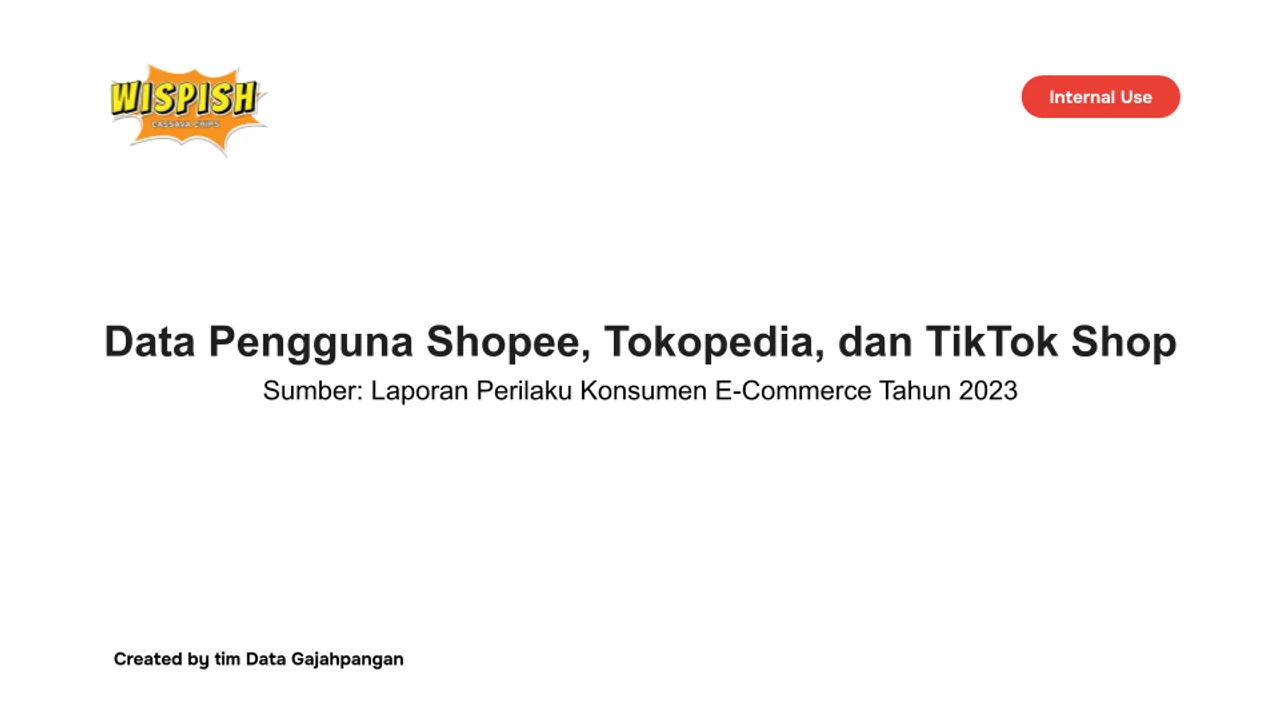
Preview loads from Google Slides only after interaction and remains inside this website.
This professional case study covers operational and commercial analysis supporting production, distribution, and profit-oriented decisions. Approved business-level outcomes are shown with team attribution; commercially sensitive operating details remain withheld.
An FMCG operation was scaling production and expanding distribution beyond Modern Trade into General Trade.
Production, channel, and commercial decisions needed a shared analytical view to support coordinated action.
I led operational and commercial analysis, visualization, recommendation development, deck production, and stakeholder presentation end-to-end within the Gajahpangan Data team. My work connected production planning, weekly sales monitoring, B2B performance, marketplace research, and social-media activation using Python, Excel, and Looker Studio.
I combined production, sales, channel, inventory, and profit data; compared actual performance with targets and prior periods; and identified bottlenecks, inventory risks, and channel opportunities. I also researched marketplace audiences and activation requirements, translated findings into decision-ready visualizations and recommendations, and presented the resulting decks for coordinated follow-up.
The output was a practical analytical workflow connecting production and profit analysis, weekly sales monitoring, B2B channel reporting, marketplace user research, social-media activation strategy, and stakeholder-ready decision decks.
During my engagement, daily production capacity increased 1,567%, from 300 to 5,000 units per day, while monthly profit grew from below IDR 100M to above IDR 700M. My analysis supported these team-level outcomes through bottleneck review, product and channel analysis, supply-chain mapping, and decision-facing reporting; it was one contribution within broader operational execution.
Operational metrics need explicit definitions and owners. Strong outcomes are most credible when the baseline, comparison period, and team-versus-individual attribution remain visible.
Outcome Validated evidence
Published outcomes stay within what can be supported by project evidence.
Supported production capacity growth of 1,567%, from 300 to 5,000 units per day
Supported monthly profit growth from below IDR 100M to above IDR 700M
Informed Modern Trade to General Trade expansion
Evidence Selected frames
Published views are selected for clarity and privacy. Open any frame to inspect it at full size.
Contact Continue the conversation